
As the old saying goes, expected returns increase as you move up in the capital stack. So why would anybody ever invest anywhere but the top of the capital stack with the highest returns? More specifically, why would the preferred investor accept a 16.3% LIRR when the common would receive 17.8%? The quick answer is risk: the preferred equity has a lower risk profile than the common equity. That means the preferred is more protected if things go wrong, so it only makes sense the common should get more if things go right. But don’t just take my word for it, let’s actually prove this out with the subject of this post: sensitivities.
Sensitivity Tables
Excel sensitivities allow us to see how a particular output changes as we modify an input variable. Sensitivity tables vary in dimensionality:
- One-way sensitivities sensitize a single variable, such as exit cap rate
- Two-way sensitivities sensitize two variables, such as exit cap rate and growth rate
Sensitivities are a staple of a career in REPE. Managers love to put them in IC decks, analysts and associates are always building them. So I suggest you familiarize yourself with the functionality of building both one-way and two-way sensitivities. For instance, The Leveraged Breakdowns Real Estate Private Equity Technical Interview Guide covers a few common interview questions you should expect on sensitivities for both stabilized and development underwriting.
Here, we’re going to dive into a one-way sensitivity. But whether you’re running a one-way or two-way sensitivity, the logic is exactly the same.
Sensitizing our Deal
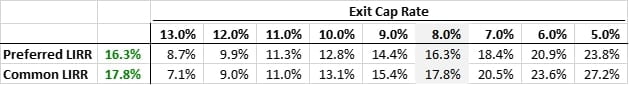
I want to plot out the returns that the preferred equity and the common equity will receive in various scenarios. This should elucidate the importance of capital structure, risk subordination, and how a waterfall influences the ultimate returns to both investors.
We’re going to sensitize exit cap rate to quickly simulate various upside and downside scenarios. The end result looks like the below. Note, the full backup to the charts we build below sensitizes from a 24.0% to a 4.0% exit cap rate in 0.5% increments. I’ve condensed for this output so it’s a bit easier to read, but the structure is the same.
Try plugging the various exit cap rates into your model to understand why the returns shake out as they do. To guide your study, here are a couple questions you should be able to answer with your model:
- What exact exit cap rate is the breakeven point between the preferred equity and common equity returns?
- What return does the common equity achieve when the preferred hits a 1.0x?
Such questions are asked daily during an REPE career, so it only makes sense you should prepare for the same during your interviews.
Sensitivity Technical Details
Before we dive deeper, some quick notes for you future analysts and associates who will be building lots of these sensitivities throughout their career in REPE:
- Building sensitivities in their own tabs keeps formatting consistent. I also find my models are easier for others to audit and review if one tab serves one purpose, and nothing more. Otherwise, it can sometimes be hard to figure out where the bottom-level modeling ends and the top-level sensitivities begin, etc.
- Sensitivity inputs need to be in the sensitivity tab, which means your model tab needs to reference the input on the sensitivity tab. If you have downloaded the members-only exclusive model, look at how the NTM exit cap rate in the Control section links to the sensitivities tab. This is an Excel quirk, but in practice it’s never much of an issue
- Call out the base case in your sensitivity output. This makes it easy for your reader to understand where the upside and downside sits. Although this particular sensitivity lives in the backend to generate our chart, it’s still nice to make obvious where our base case is.
In the next post, we are going to finish this case study with a chart that visually describes this investment in one image. This final installment of the series will really drill down on seniority and why the preferred investor would choose to forego its upside for some downside protection.
Study with Leveraged Breakdowns
Interested in an REPE career? Leveraged Breakdowns is maintained by Manhattan Megafund investors with a passion for sharing knowledge. We teach everything you need to successfully land a career in REPE. All you need is to put in the effort. Join us today for exclusive benefits such as our technical interview guide, member-only downloads, and access to our video lectures where you can watch us build Excel models in real time.