
Introduction
Catch-up waterfalls are a common staple throughout a career in real estate private equity. And comprehension thereof is frequently tested in REPE interview questions. Luckily, we’re here to help! The first post in this series introduced the case prompt. Now, this post will seek to address question one in that original prompt. Namely, this post will teach you how to model the gross returns for the investment opportunity. Then, subsequent posts will show you how to build the catch-up waterfall.
Build the Title and the Timeline
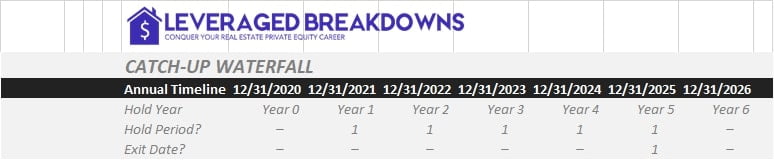
Working top-down, I always begin my models with a page title. Next, if it’s a cash-flow centric page, I like to put the timeline at the very top so the frozen panes take up less space. Below my timeline are additional controls that I later reference in my cash flows. These additional timeline controls help me centralize the logic which determines my hold period and entry/exit timing.
Build the Control Panel
The next section I build is my control panel. Inexperienced modelers will scatter their control variables all over the place. Don’t do this. An outside user looking to tweak your assumptions should easily find all controls centralized in the control panel. Also, building a control panel is the best way to begin any REPE case study. The process of mapping out your controls from the start allows you to move away from the case prompt into the modeling itself, and it gets your brain primed for the work ahead.
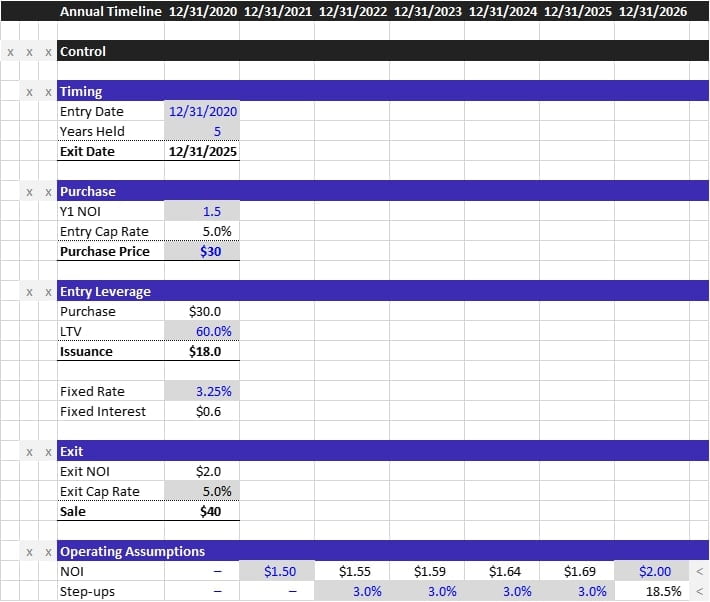
All of the variables in the control panel were provided in the case. But to make it obvious, here’s everything mapped out:
- Timing: This is where I control the hold period. These inputs control the timeline and additional logic explained earlier
- Purchase:You should nearly always show the going-in NOI, Value, and Cap Rate when displaying your purchase assumptions. I build this section in a way that reads the same as the value equation NTM Entry NOI/Entry Cap Rate=Entry Value
- Exit: Same exact equation as entry, just for exit. I pull the exit NOI using a lookup formula on the operating assumptions below. Notice my timeline extends to Year 6, so that final $2.00M NOI assumption will represent our exit NOI
- Operating Assumptions: This is a quick-and-dirty way to input our operating assumptions. Because this property is leased quadra-net, rent is NOI. We know NOI starts at $1.5M, grows at 3.0% per year, then will step up to $2.0M when we lease to a market tenant. The controls here do just that
You don’t have to memorize the way I’ve grouped these variables. Just organize your control panel in a way that would make sense to an outside reader. There are plenty of ways to eat a kiwi, the above is just how I like to do it. So long as you make it obvious and group logic together, your model will be fine. Creating analyses that are easily understood is perhaps the core skill for a successful career in real estate private equity.
But for those curious, more detail on my particular formatting choices is in the final article from the LSI bond case study.
Build the Cash Flows
Finally, we build our cash flows. Cash flows are separated between unlevered and levered cash flows. If you aren’t familiar with this bifurcation, I suggest you study our Starter Kit and Technical Guide for REPE Interview Questions.
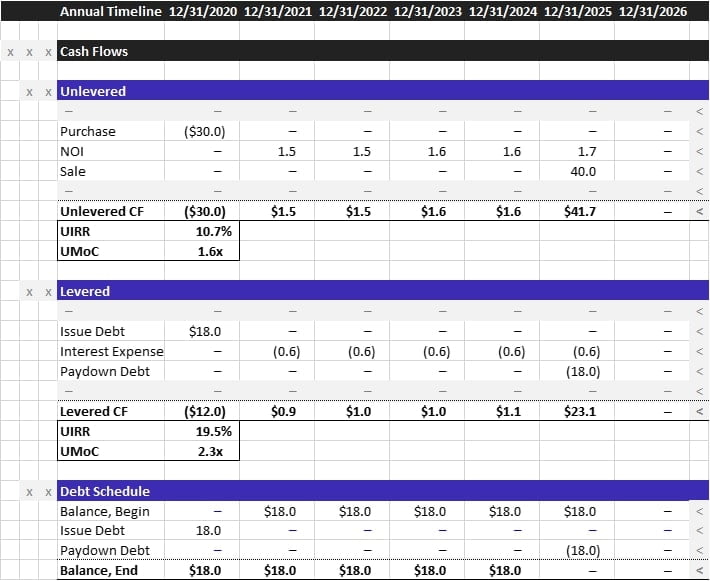
The unlevered cash flows include:
- Purchase: We purchase this property for $30M
- NOI: We collect rent, earning $1.5M to $1.7M of NOI over the hold period
- Sale: We lease this property to a new tenant for $2.0M of NOI, then immediately sell it at a 5.0% cap rate before generating any NOI from that lease. This results in a $40M exit value
When you run an XIRR formula on these unlevered cash flows, you anticipate earning a 10.7% unlevered IRR. This high pre-leverage return is indicative of the leasing risk baked into this opportunity.
Moving onto the levered cash flows:
- Issue debt at 60.0% LTV
- Pay interest at 3.25% fixed
- Pay down the debt at exit
The leverage brings the deal returns to a 19.5% levered IRR (LIRR) and a 2.3x levered multiple on capital (MoC). This answers the first question of the prompt: “what are the gross returns of this investment?” Gross just means before any fees that we charge the LP.
In the next article, we will focus on building the catch-up waterfall, which will calculate the fees that the LP has agreed to. Once we know the LP fees, we can calculate the answer to the second question of the prompt.