
Executive Summary / “TLDR”
The single-family rental sector is still in its early days, having emerged following the 2008-09 financial crisis and collapse in U.S. housing prices. The sector is well positioned going forward, with demand for single-family rental homes outpacing supply. Demand is supported by both demographic tailwinds (millenials entering prime family-formation years) and COVID accelerating the demand for suburban living. Supply of single-family homes is something to keep an eye on, but for now all signs point to landlord pricing power and strong growth ahead.
Background
The single-family rental (SFR) real estate sector originated following the 2008-09 global financial crisis which resulted in a collapse in U.S. housing prices. During the five-year period from February 2007 to February 2012, housing prices fell approximately 26% peak-to-trough.1 Certain markets, like Las Vegas, experienced a decline in home prices of roughly 60%. As a result of the severe decline in housing prices, multiple real estate private equity firms, including Blackstone and Starwood, began purchasing homes out of foreclosure and through the MLS.
In total, real estate private equity firms acquired roughly 300k homes combined during the period from 2011-2015, representing a little over 1% of total U.S. home sales2 during those years. Following a period of industry consolidation, two large public companies emerged — American Homes 4 Rent (NYSE: AMH) and Invitation Homes (NYSE: INVH) — in addition to a number of private players. The total number of homes owned by institutions hasn’t grown all that much since 2015. The number today stands around 300k homes in the U.S., out of a total pool of approximately 16 million single-family rental homes, or just 2% of the total. The vast majority of single-family rental homes in the U.S. are still owned by “mom and pop” investors.
Major Players Today
The major institutional players and corresponding size of their portfolios are detailed in the chart below. The two largest players are both public companies, with the remaining players either private companies or, in one case, a division within a larger public company. In addition to the below, there are a number of smaller-scale portfolios that are more difficult to track. While there has been a fair amount of industry consolidation to date, there is still room to go on that front.
| Company | # Homes |
| Invitation Homes (INVH) – Public | 80k homes |
| American Homes 4 Rent (AMH) – Public | 50k homes |
| Progress Residential (Pretium) – Private | 40k homes |
| Tricon Residential (Tricon Capital) – Public | 23k homes |
| FirstKey Homes (Amherst Residential) – Private | 20k homes |
| Main Street Renewal – Private | Undisclosed |
Historical Sector Performance
Since inception, the single-family rental sector has experienced solid top-line growth. Given that incremental demand has outpaced incremental supply, landlords have enjoyed pricing power, resulting in average rent growth of nearly 4% since 20153. In addition, occupancy has been on the rise during that same period, topping out around 97% in 4Q 20204. Expense growth has been more of a mixed bag, with expenses often elevated due to seemingly recurring “one-time” weather events that impact repairs and maintenance expense, as well as large property tax increases as a result of strong home price appreciation. That said, bottom-line NOI growth has remained strong as well, in the 4%+ range for the two public companies.
Points of Difference vs. Multifamily/Apartments
Since the single-family rental sector is often compared against its more well-known peer, multifamily/apartments, it is instructive to highlight the main points of difference between the two sectors. Below is a chart that highlights these differences. Note that this data is collected from public companies that report on these various metrics.
To briefly summarize, when compared to apartments, single-family rental homes generally have more square footage, one additional bedroom, lower monthly rent, and stickier tenants. On the expense side, for single-family rental, property taxes are a much larger percentage of overall expenses. Also, property management expenses are generally higher on a percentage basis, given that it costs more to manage a portfolio of 100 homes across a few different neighborhoods vs. an apartment building containing 100 units.
| Metric | Single-family Rental | Multifamily/Apartments |
| Average rent/month | $1,500-$1,800 | $2,000+ |
| Average unit size | 1,900 square feet | < 1,000 square feet |
| Number of bedrooms | 3 bedrooms, 2 bathrooms | 2 bedrooms, 1.5 bathrooms |
| Average monthly rent psf | Less than $1 psf | More than $2 psf |
| Average tenant length of stay | 3 years | 2 years |
| Property tax as a % of revenue | Approximately 17% | Approximately 13% |
| Property management fees | 6%+ | 3%-4% |
Key Economic Drivers
Using the supply-demand framework for real estate, below are the key drivers of both demand and supply.
Key Factors that impact Demand
- Household Formation: defined as the net change in number of households in the U.S. or in a given market (impacted by population growth and age distribution, strength of the job market/economy, immigration, and societal norms).
- Mix of Demand for Multifamily vs. Single Family Housing: influenced by demographics (i.e. age cohort demand for urban apartment dwelling vs. suburban single-family homes) and societal norms.
- Preference for Owning vs. Renting Single-Family Homes: influenced by mortgage rates, savings rates, and lifestyle preferences.
- Conclusion: Strong Demand driven by millennials entering prime family-formation years, COVID accelerating the move from urban to suburban living, and millennials’ preference for renting vs. owning.
Key Factors that impact Supply
- Supply of Total Housing Units: incremental multifamily and single-family housing units, as tracked by Housing Starts.
- Supply of “Starter Homes” vs. “Trade-Up Homes”: inventory of starter homes is influenced by homebuilder behavior, where the less-attractive economics of building lower-cost homes disincentivizes construction of starter homes.
- Conclusion: Constrained Supply, though Ticking Higher, driven by the homebuilding deficit following the 2008-09 financial crisis and limited supply of starter homes, partially offset by a recent uptick in single-family housing starts since COVID.
Conclusion
The single-family rental sector is approximately a decade old, having emerged post-global financial crisis. The sector has performed well to date, and the larger players have proven that it is possible to efficiently manage a portfolio of single-family homes with solid growth and margins. Going forward, demand will likely be driven by favorable demographic tailwinds, with the sizable millennial generation reaching its prime family-formation years. This will drive a migration from urban apartments to suburban single-family homes (see demographic chart below as support).
COVID has accelerated this trend, given the increased demand for more space and less-urban living conditions, incited by social-distancing measures of the pandemic. While this social-distancing phenomenon may be somewhat temporary, the behavior and lifestyle changes that result from it may be more permanent. Supply of single-family homes remains in check for now, but is something to watch closely, as there has been an uptick in single-family housing starts following COVID. Overall, the outlook for the sector is very positive.
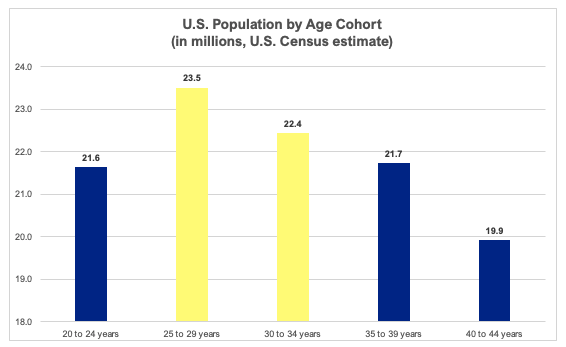
Source: U.S. Census Data, as of 2019
Looking to learn more? Why not check out our educational resources! Whether you’re yet to begin a formal real estate private equity interview process or are crunching through real estate private equity interview questions at the last minute, we have what you need. All you need to bring is your effort.
Appendix: Key Drivers for Evaluating Single-Family Rental Investments
Unlike other property types, single-family rental acquisitions are modeled on a portfolio basis vs. an individual property basis. This is because each individual home is such a small ticket size that they are generally acquired by investors in the form of a large portfolio of homes. As such, in modeling one must use portfolio-specific assumptions vs. property-specific assumptions that are used for most other property types.
Below are the key metrics to consider when analyzing and modeling single-family rental portfolios. Keep in mind that this is NOT an exhaustive list, but rather covers the critical items that really matter. Think of this as a list of items that a senior person would ask about when looking at a single-family rental acquisition for the first time.
Portfolio/pricing items
- Size and cost of the portfolio (number of homes and total estimated cost, including a cost per home figure)
- Cap rate (if provided, both nominal cap rate and cash cap rate after factoring in capex)
- Location or MSAs (gives us an idea of attractiveness of the portfolio from a job growth/demand standpoint)
- # of homes per market (gives us an idea of how much scale/efficiency there is in managing the portfolio)
- Average age of homes and average date acquired by current owner (gives us an idea of how much capex may be required upon acquisition)
Key Revenue items
- Average monthly rental rate (gives us an idea of the quality of the portfolio and segment of the market)
- Occupancy (gives us an idea of how well the portfolio is being managed by the current owner and how much upside there might be)
- Other income as a % of revenue (this may be a potential source of upside going forward)
- Annual rental rate growth for the last 2-3 years (gives us an idea of how hard the owner has been pushing rents in the recent past)
Key Expense items
- Expense margin or NOI margin (gives us an idea of how well the current owner has been managing expenses)
- Annual recurring capex: R&M capex plus turnover capex (key numbers for the sector that are reported below the line, or after NOI)
- Net cash flow margin (gives us an idea of how well the current owner has been managing expenses, including capex expense)
Leverage
- Existing debt amount and terms of debt (gives us an idea of what a prospective levered return might look like, assuming the same debt terms can be achieved)